February 4th Technical Analysis: ETH, XRP, SOL, BNB and LUNA
Technical analysis of the ETH ETH has had a very good week, up nearly 17%. Today the price broke the
This week we take a closer look at ETH, XRP, ADA, SOL and LUNA.
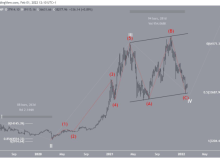
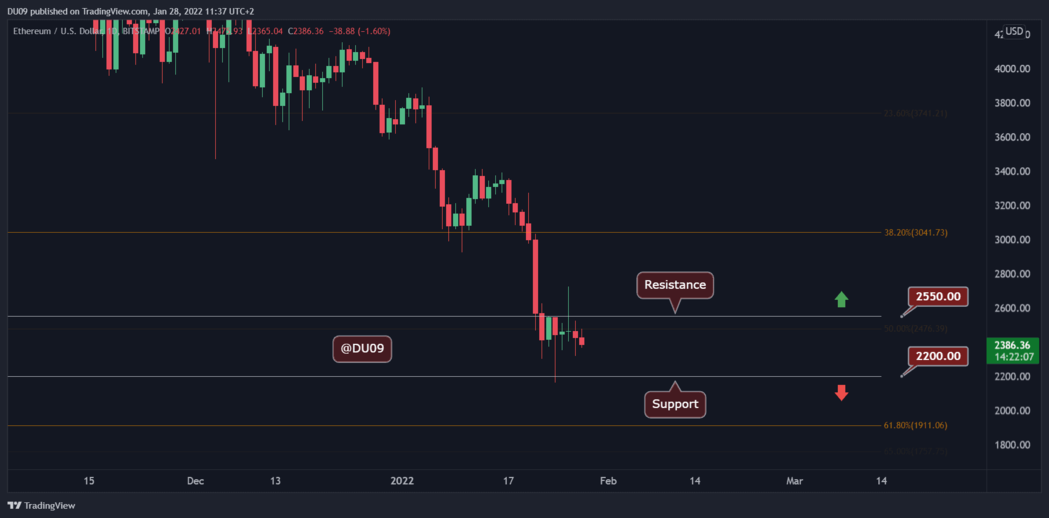
Last week, ETH finally found support after falling below $3,000. The support at $2,200 halted the downtrend and the price is currently in a mode of consolidation below the critical resistance at $2,550. ETH has been quite difficult during this period with losses of up to 20%.
The largest altcoin by cap attempted a rebound last Wednesday, briefly reaching $2,725 before sellers pushed the price back below a key resistance level. Since then, ETH has failed to retest this level and has traded sideways. While such a move suggests hesitant price action, at least the recent move has prevented ETH from tumbling lower.
When prices consolidate, market participants become more nervous as there is no way of knowing if there will be the next correction or bounce after this consolidation. Indicators do not give confidence to buyers and the market generally looks weak.
Source: TradingView
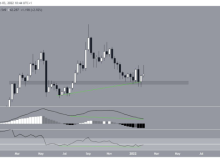
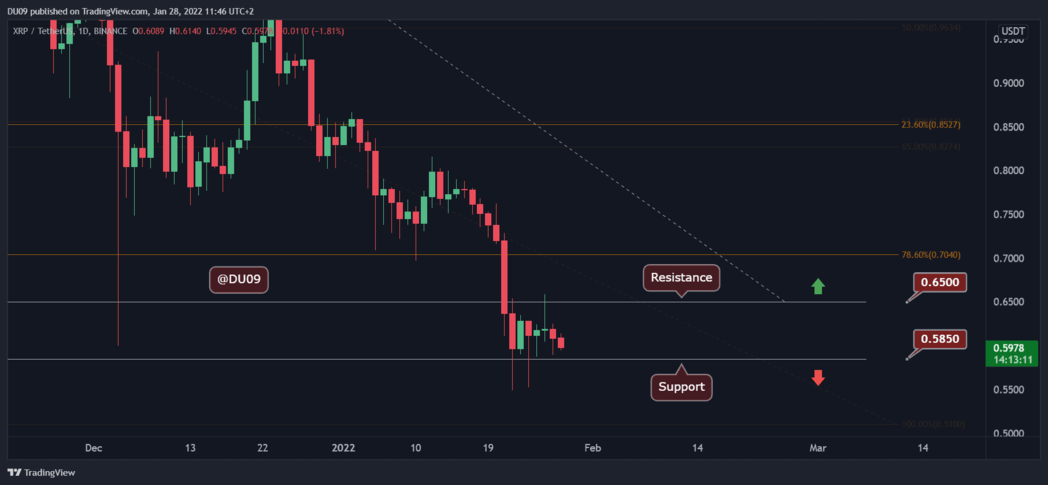
XRP has hovered just above the critical support at $0.58 most days for the past week after falling sharply last Friday. Overall, XRP is down 17% from 7 days ago and has yet to recover most of its recent losses.
Current price action lacks confidence and a retest of key support is likely. XRP found resistance at $0.65 and the latest retest was fiercely rejected by the bears. Since then, the price has steadily declined towards the support line.
In the short term, XRP does not have enough buying pressure to generate momentum and if the market remains weak, it is possible for sellers to seize the opportunity to push the price lower again. The daily time frame RSI has not exited the oversold territory in over a week, signaling a strong downtrend as prices are still trending south at the moment.
Source: TradingView
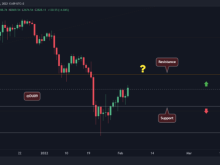
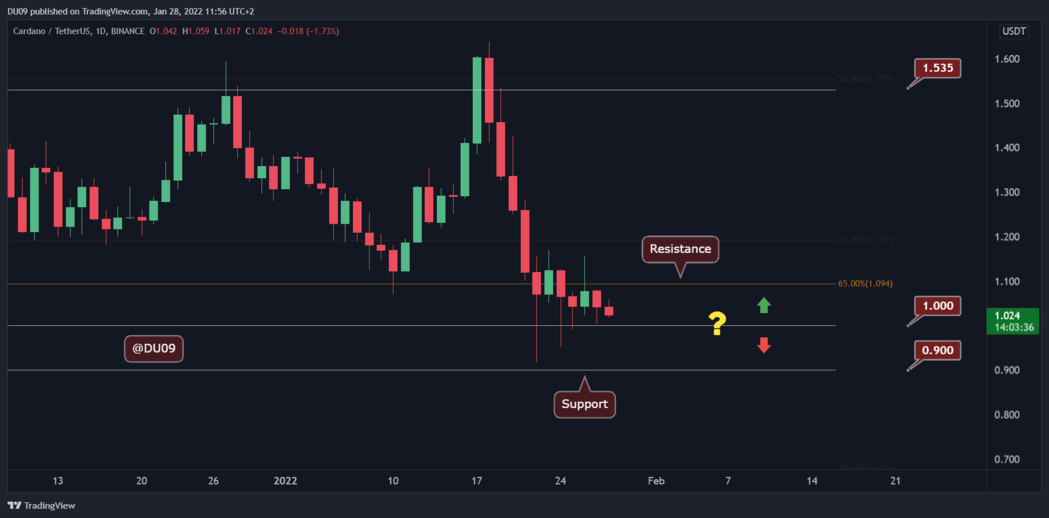
ADA is drawing a clear path to test the $1 support level after failing to break the $1.10 resistance. The price continues to make lower highs. In the last 7 days, ADA has lost 19% of its value.
Additionally, as the cryptocurrency hit an all-time high of $3.1, the trend turned in a bearish direction and led to lower lows. The recent lower low was made last Saturday. This again confirms the downtrend and will likely continue to do so. Basically, the volume has also decreased significantly, which explains why the price is hesitant about its next move.
A break below $1 could have a major psychological impact on the future price action of ADA. Therefore, the market is expected to witness a significant struggle in the coming days as buyers and sellers battle for dominance at this key level.
Source: TradingView
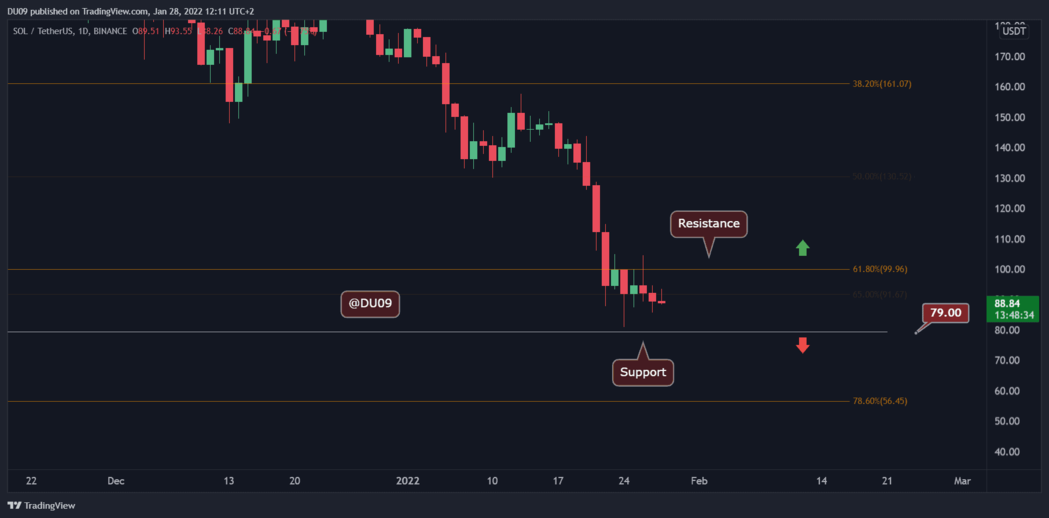
SOL is acting similar to ADA and is also hovering just above the key $79 support. The price action remains bearish with lower highs and lower lows after failing to break the key resistance at $100. There are chances that the price will retest the support and the SOL has closed the last 7 days in the red losing 30% of its value.
Sellers continue to dominate price action with 5 daily red candles for the past 7 days. In addition, the daily RSI has been floating flat in the oversold territory around 24 points for over a week. SOL’s failure to recover and stay away from such negative levels is a warning sign that sellers may not be done with their job.
Looking ahead, SOL has a decent chance of stopping the downtrend at the $79 support. Then, when buyers return to the market, the price can try to recover.
Source: TradingView
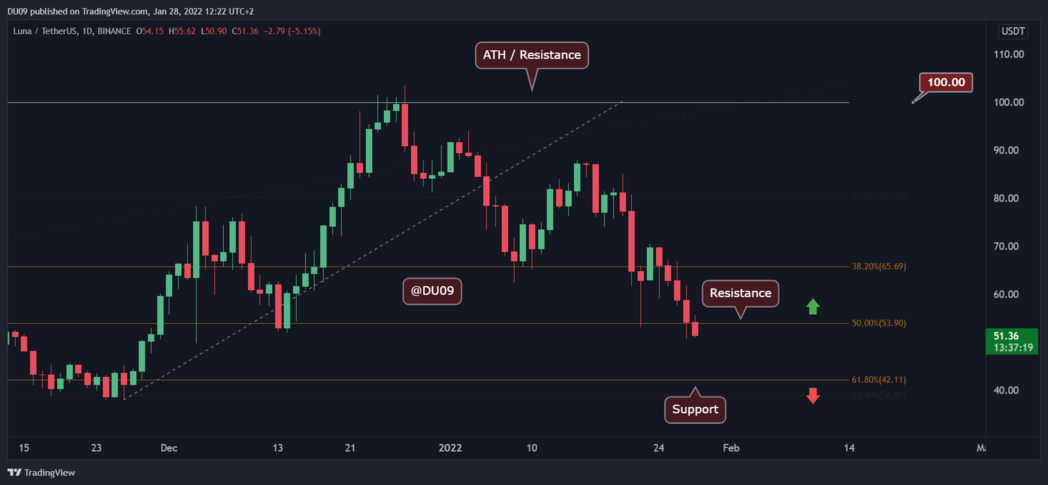
LUNA lost a key support level yesterday, falling below $54 and now seems poised to drop further. If the buyers fail to halt this sell-off, LUNA is likely to slide to the next support at $42. Overall, the price had a very disappointing week, losing 33% of its value in 7 days.
Previous support at $54 has now turned into resistance and indices are in free fall. The daily RSI has yet to break into the oversold zone, suggesting that LUNA could fall further for some time before getting there and attracting buyers again.
The MACD-Histogram and moving averages are also extending lower and there is little sign that the sell-off will end anytime soon. Right now, sellers are dominating the chart with 6 red candlesticks for the past 7 days.
Source: TradingView
You can see the price of the coin here.
Join Bitcoin Magazine Telegram to follow news and comment on this article: https://t.me/coincunews
Disclaimer: This article is for informational purposes only, not investment advice. Investors should research carefully before making a decision. We are not responsible for your investment decisions.
home home
According to Cryptopotato