Cryptocurrency Market February 1, 2022: Bitcoin and Ethereum Gaining Momentum, SOL and LUNA Rising Sharply
Cryptocurrency market February 1, 2022: Bitcoin price is still well above $36,500. As a result, BTC started
The cryptocurrency market was volatile on Thursday as traders reacted to the Federal Reserve’s decision to leave interest rates unchanged. Bitcoin, Ethereum and several major altcoins are all facing price uncertainty as the Fed is expected to hike interest rates in March.
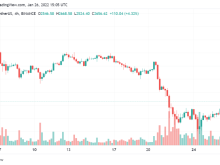
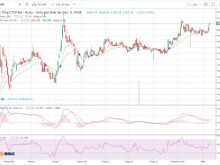
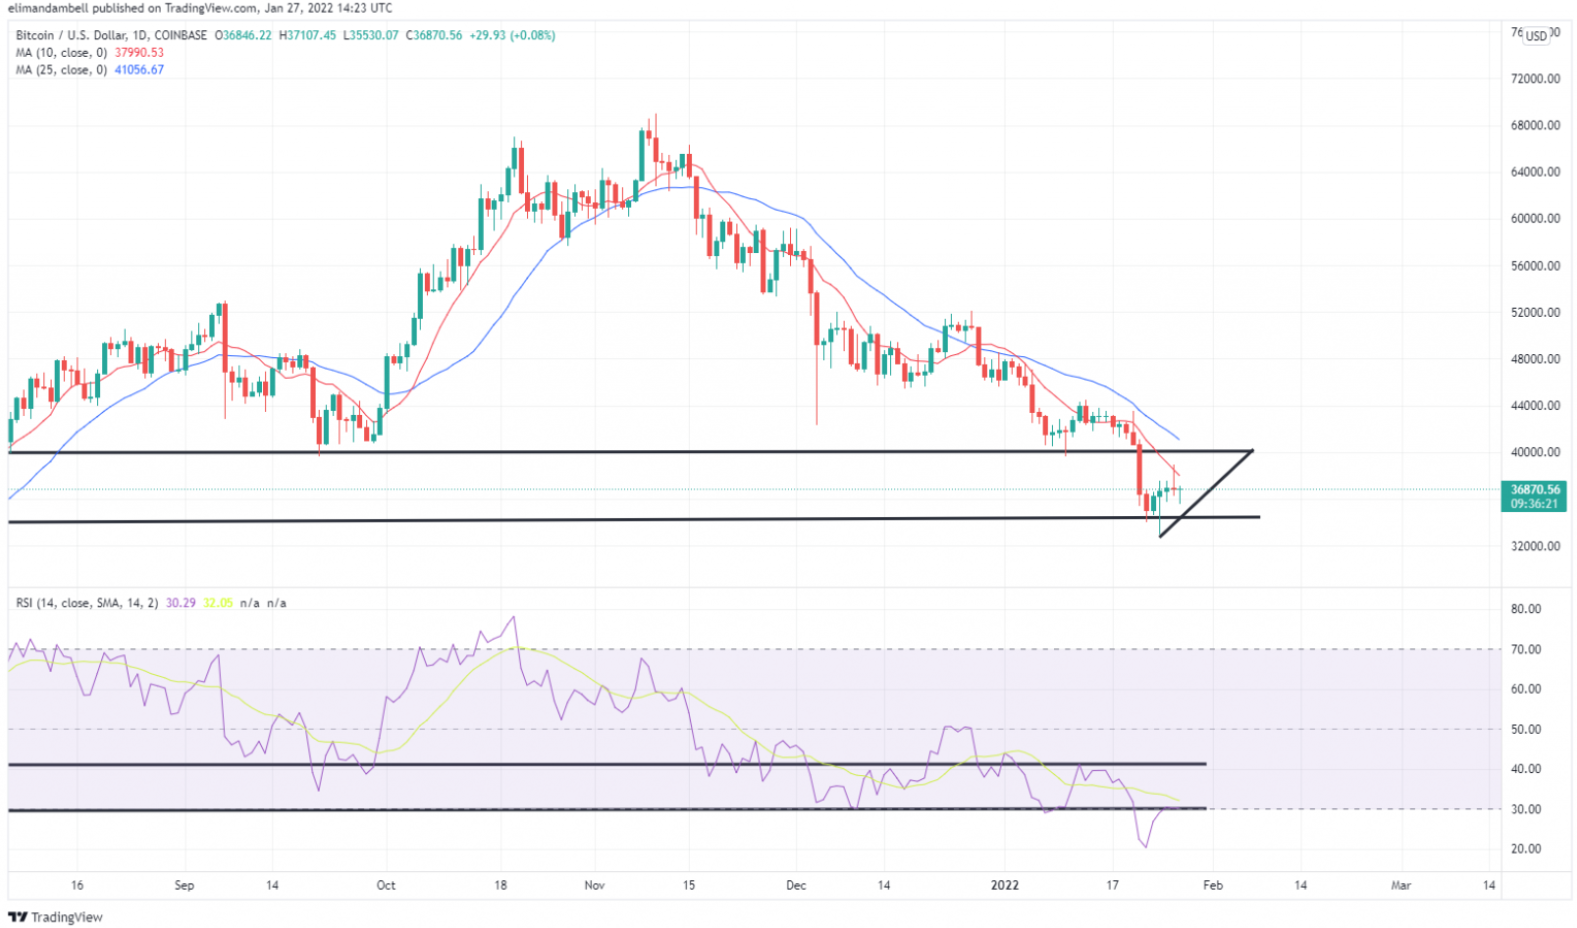
After rallying towards the $40,000 resistance while trading above $38,000 on Wednesday, BTC/USD fell to a low of $35,690 during today’s trading session.
Thursday’s move comes as uncertainty rises in the crypto market, leading to the formation of today’s doji candlestick, which usually means the price is neither rising nor falling.
After this uncertainty, the RSI indicator is currently floating around 30, which means that Bitcoin remains in the oversold territory.
This RSI level appears to be a resistance that could be the reason for today’s price inactivity, so traders will have to wait and see if a breakout is possible.
Overall, the short-term momentum continues to be higher as evidenced by the current ascending triangle and sustains hopes for a move towards the $40,000 resistance level.
BTC/USDT daily chart | Source: TradingView
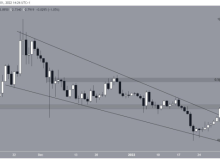
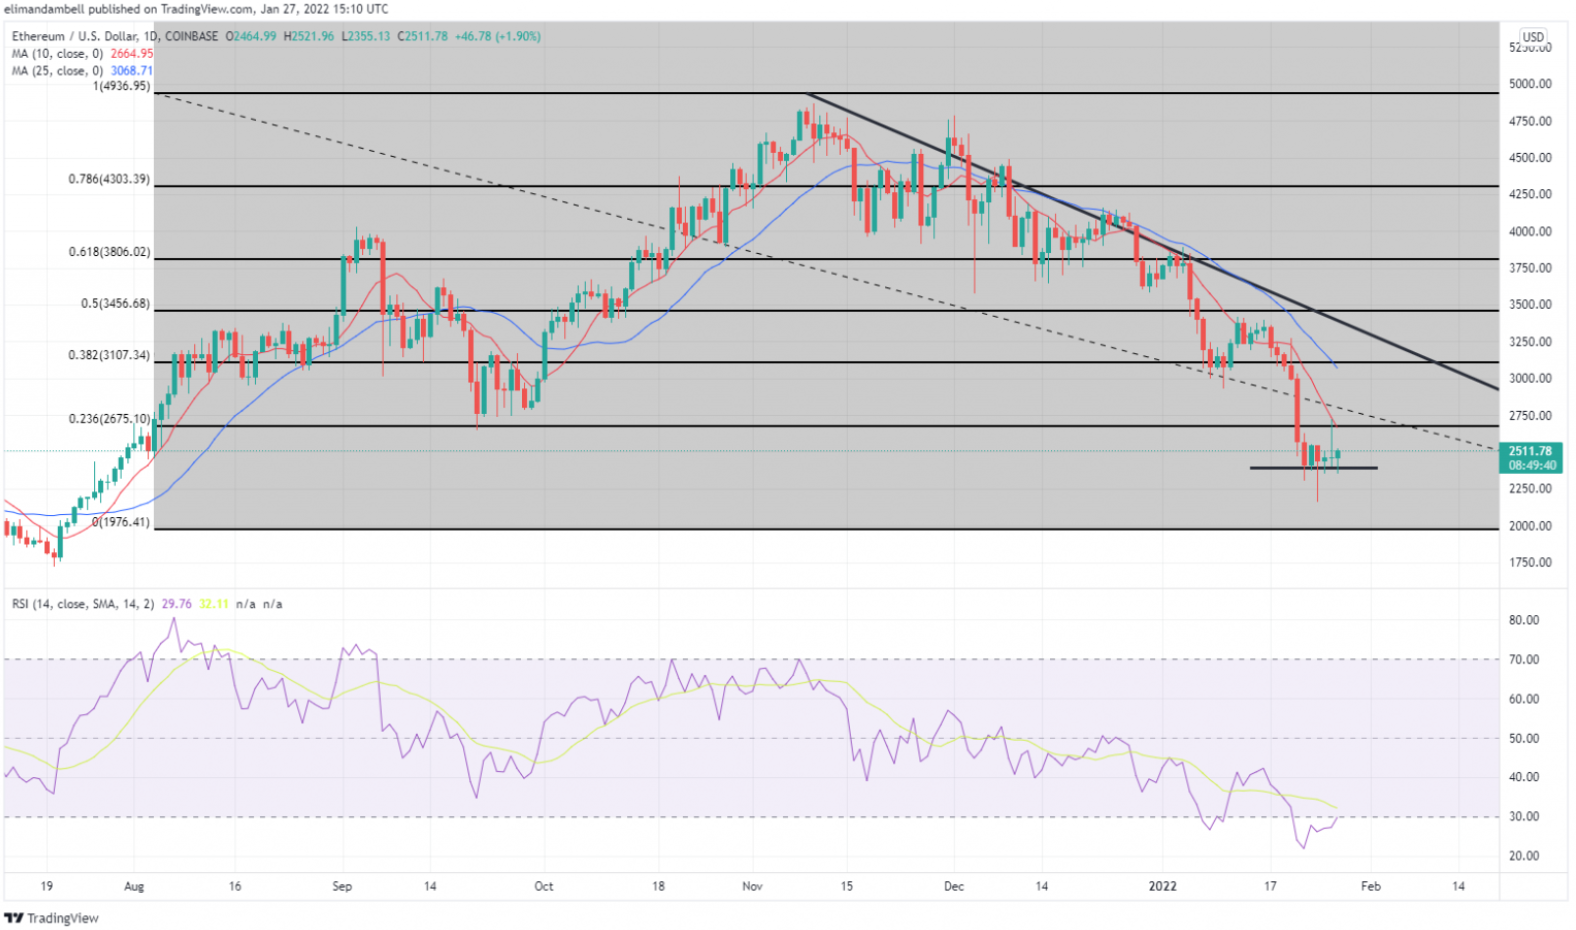
ETH is trading almost 5% below yesterday’s high, however, the price appears to be consolidating rather than selling.
After Wednesday’s high at $2,705.78, ETH/USD quickly fell below the 0.236 Fib level to hit a low of $2,366.13.
This drop appears to be retesting the near-term support at $2,390, which is where ETH has been mostly trading this week.
Looking at the current RSI trend, similarities to BTC can also be seen, with both oscillating around the 30s mark.
ETH/USDT daily chart | Source: TradingView
The Sandbox (SAND) was one of the biggest gainers on Thursday, up as much as 8% following news of its partnership with WMG.
It was announced that the collaboration was in hopes of creating a concert venue/amusement park in the Metaverse.
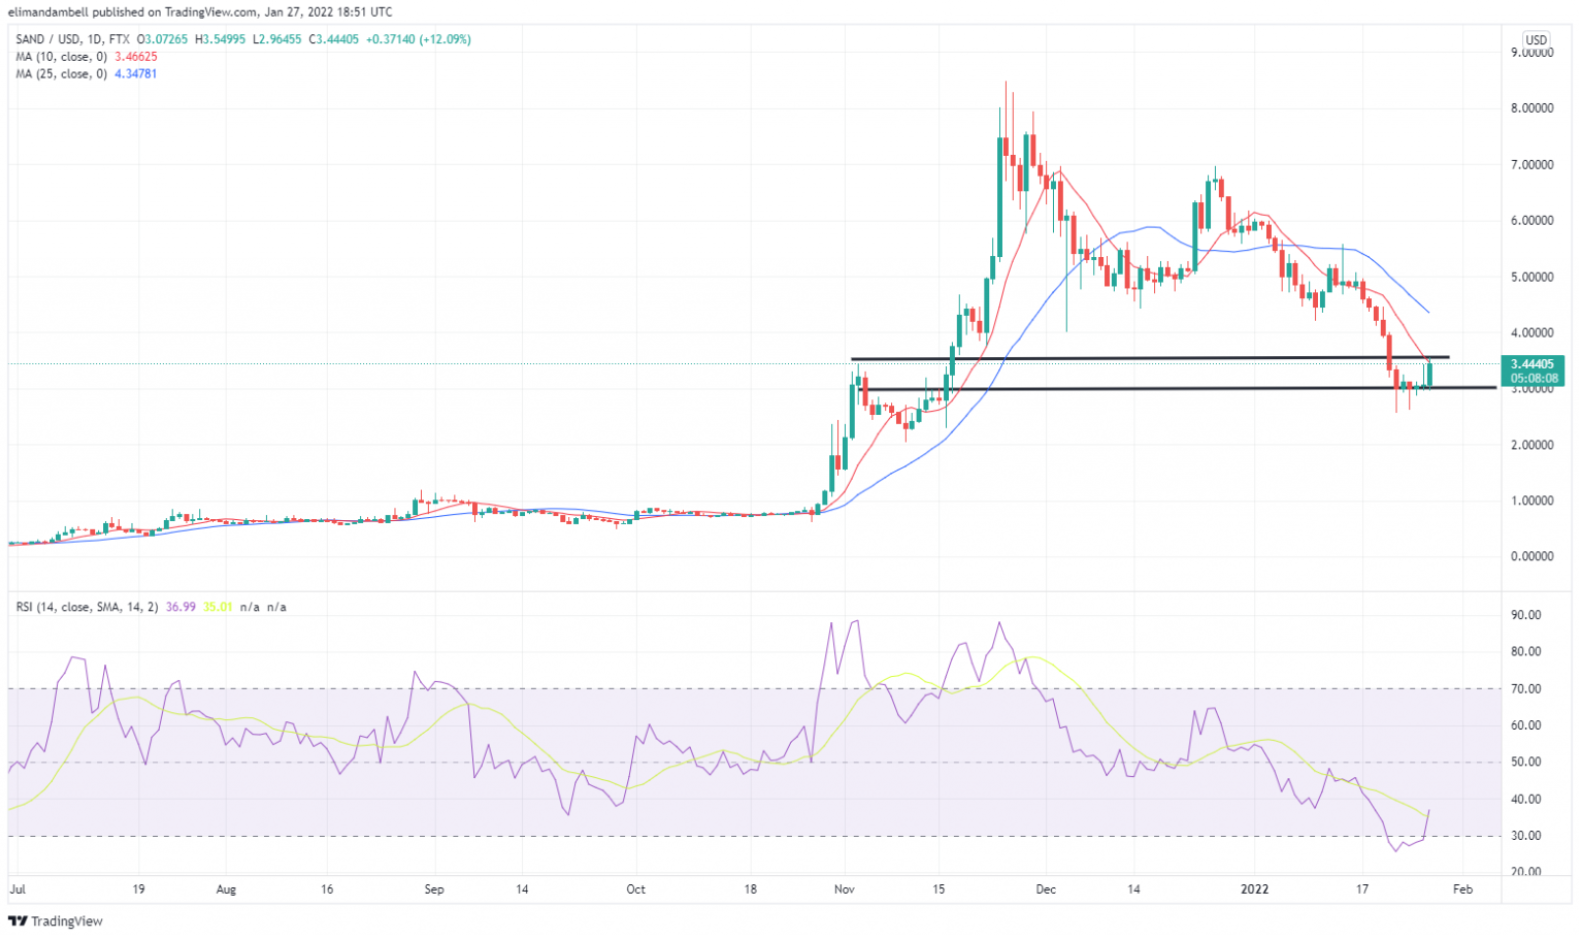
SAND/USD hit an intraday high of $3.54 which is a 5-day high and comes after a rally from the $2.99 support.
Today’s move helped propel SAND into the top 40 cryptocurrencies, displacing helium (HNT) in the process.
Looking at the chart, the price has fallen somewhat from today’s high and is currently below the short-term ceiling of $3.57.
SAND/USDT daily chart | Source: TradingView
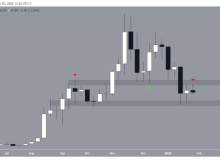
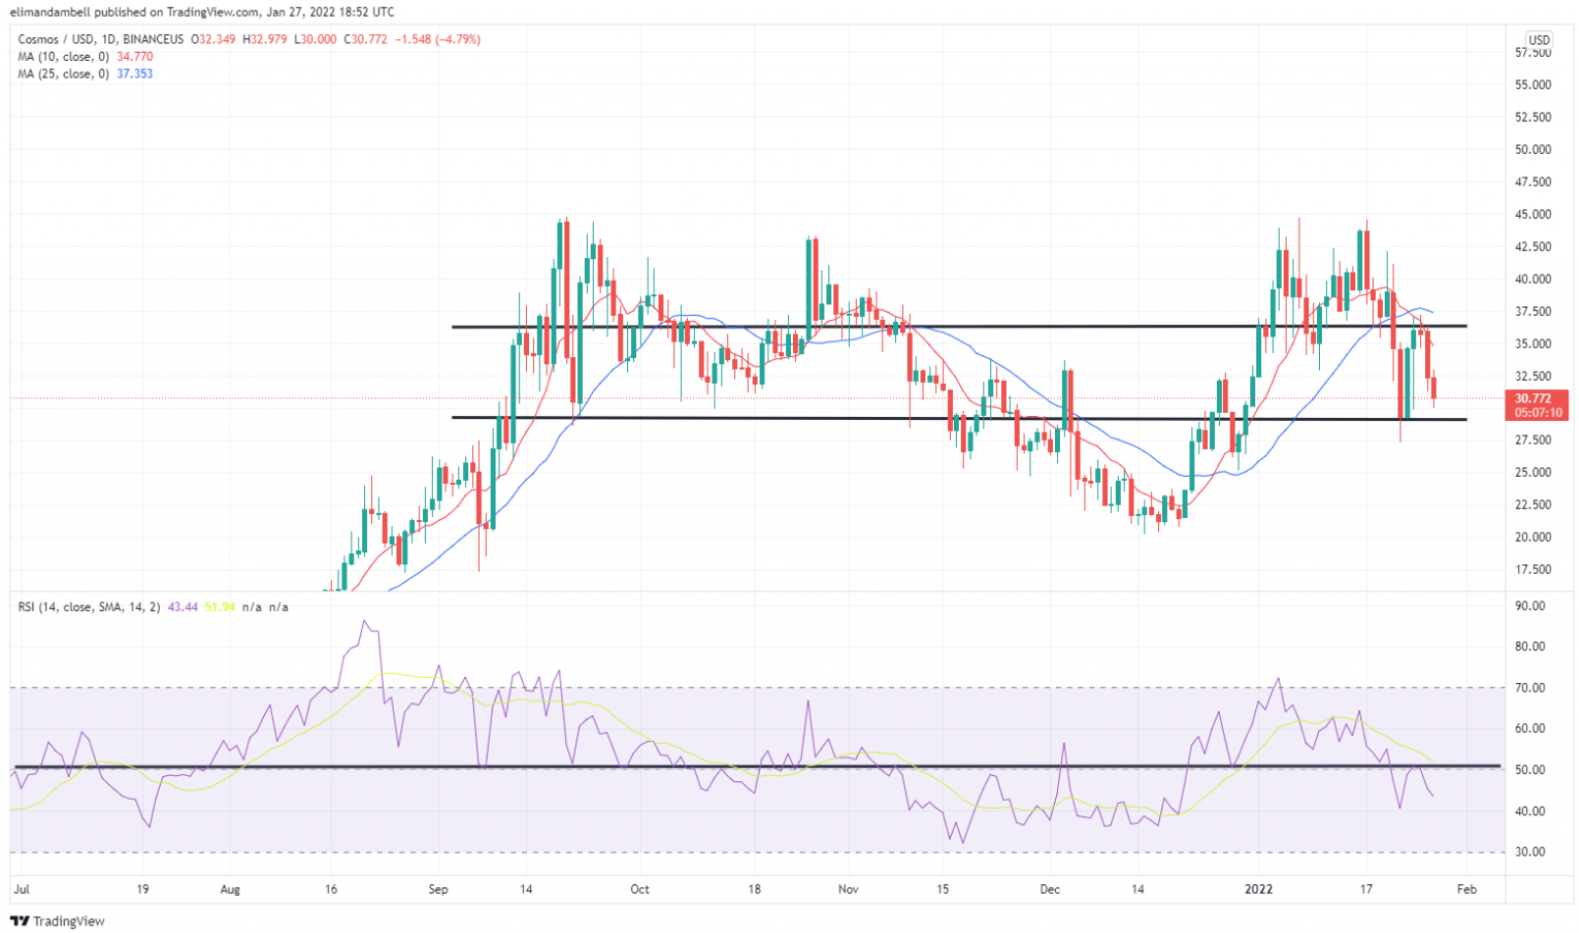
Cosmos (ATOM) fell for the second straight session, falling to an intraday low of $30.14. This drop brought ATOM to the #20 rating by crypto market cap among DAI.
The move led ATOM/USD to extend its recent sell-off that started at the $36.30 resistance earlier in the week.
Over the weekend, ATOM attempted to breach this ceiling, but market strength waned as the RSI’s 50 level thwarted any gains.
This level has historically acted as uncertainty and coincides with a bearish cross generated by the moving averages.
Looking at the chart below, the recent decline appears to have only started when the 10-day ma (red) breached the 25-day ma (blue).
ATOM/USDT daily chart | Source: TradingView
Join Bitcoin Magazine Telegram to follow news and comment on this article: https://t.me/coincunews
SN_Nour
According to News.bitcoin