Bitcoin (BTCD) dominance may have reached a long-term bottom
Bitcoin Dominance (BTCD) is attempting to find support after being rejected by the Fib resistance level.
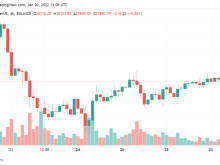
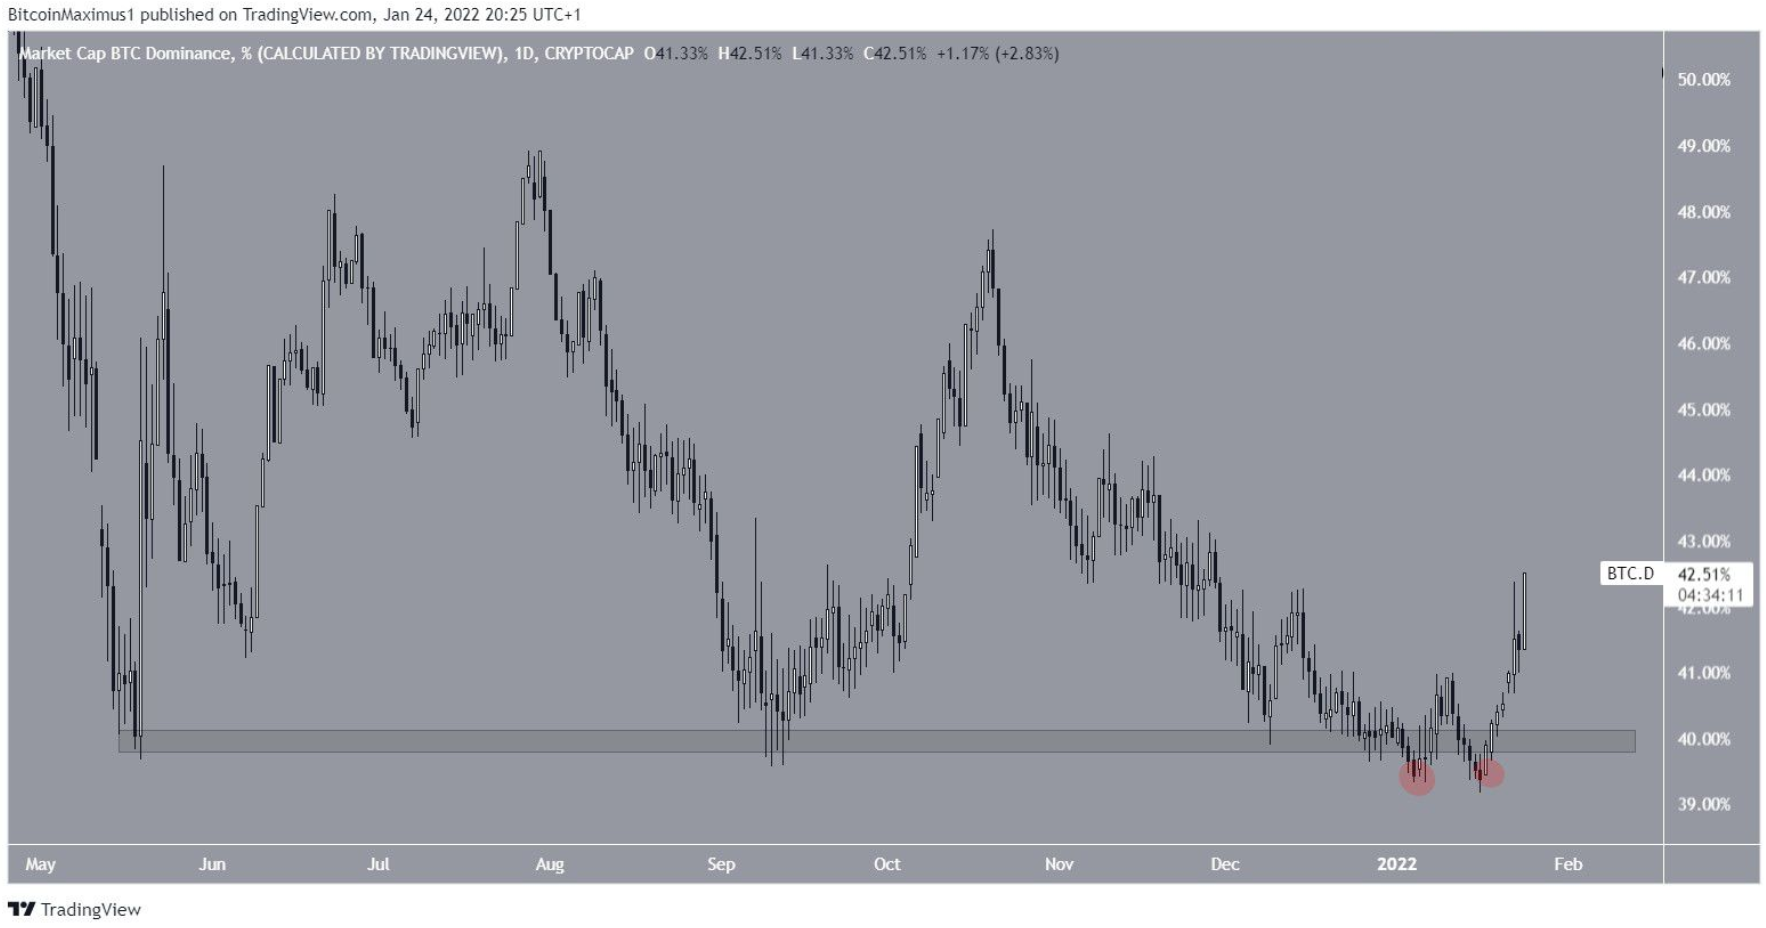
Bitcoin (BTCD) dominance has been on the rise since Jan. 16, reclaiming a key horizontal zone in the process.
Since May 18, 2021, Bitcoin dominance has tended to hold above the 40% horizontal support area. This zone has supported BTCD many times since then. The rebound from this support led to a local high of 47.72% on October 20, but the price started falling shortly after.
In early 2022, BTCD dipped slightly below this support area (red circle) twice before regaining it on January 21st.
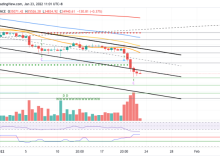
BTCD daily chart | Source: TradingView
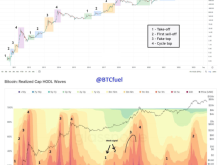
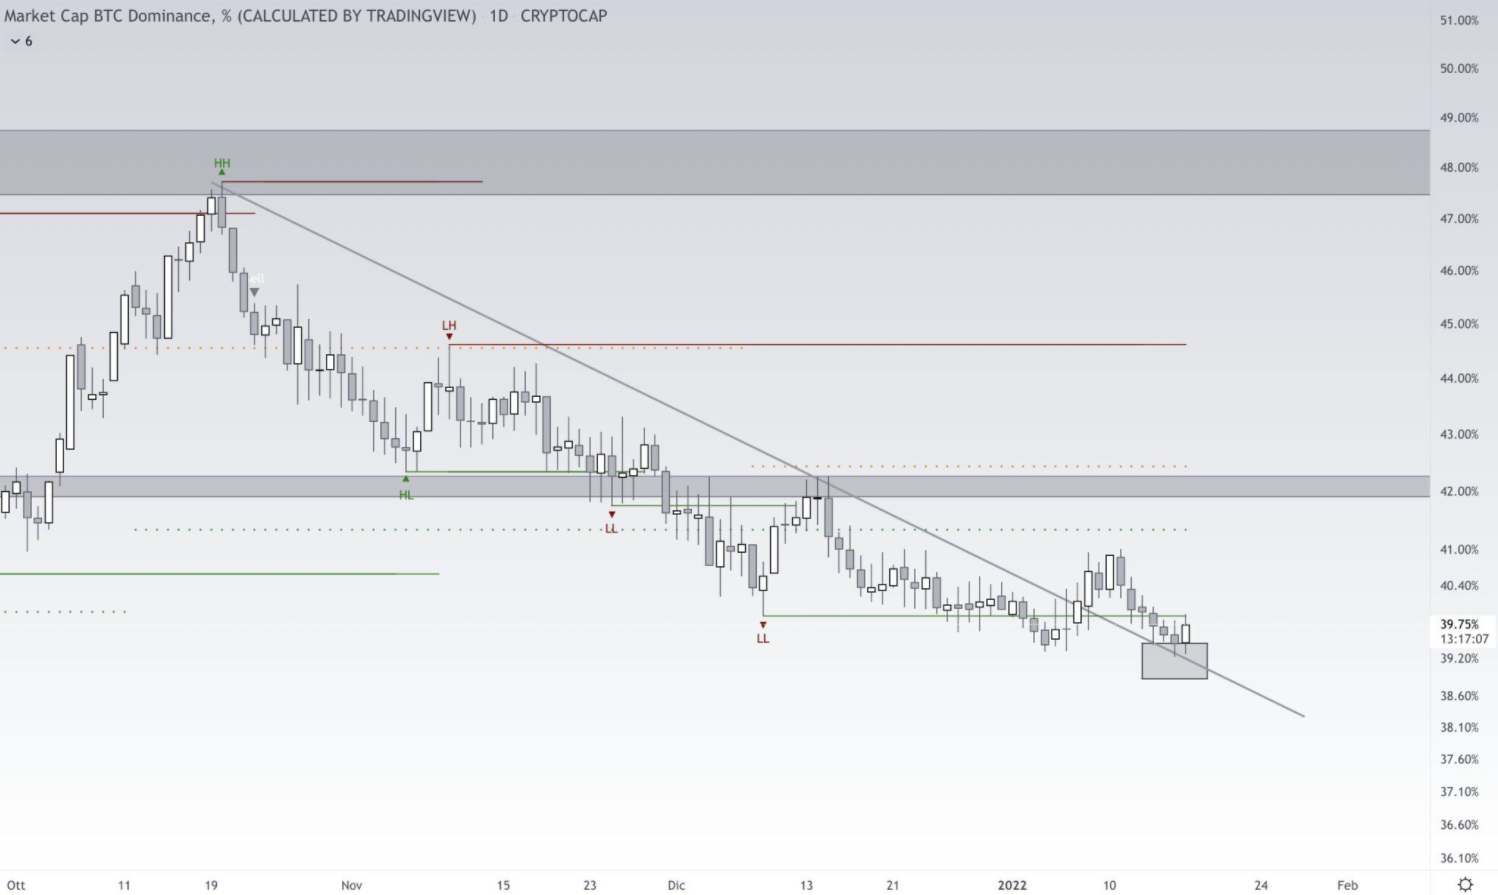
Trader @eliz883 tweeted a BTCD chart and explained that the current rally could herald a very strong rally.
The source: Twitter
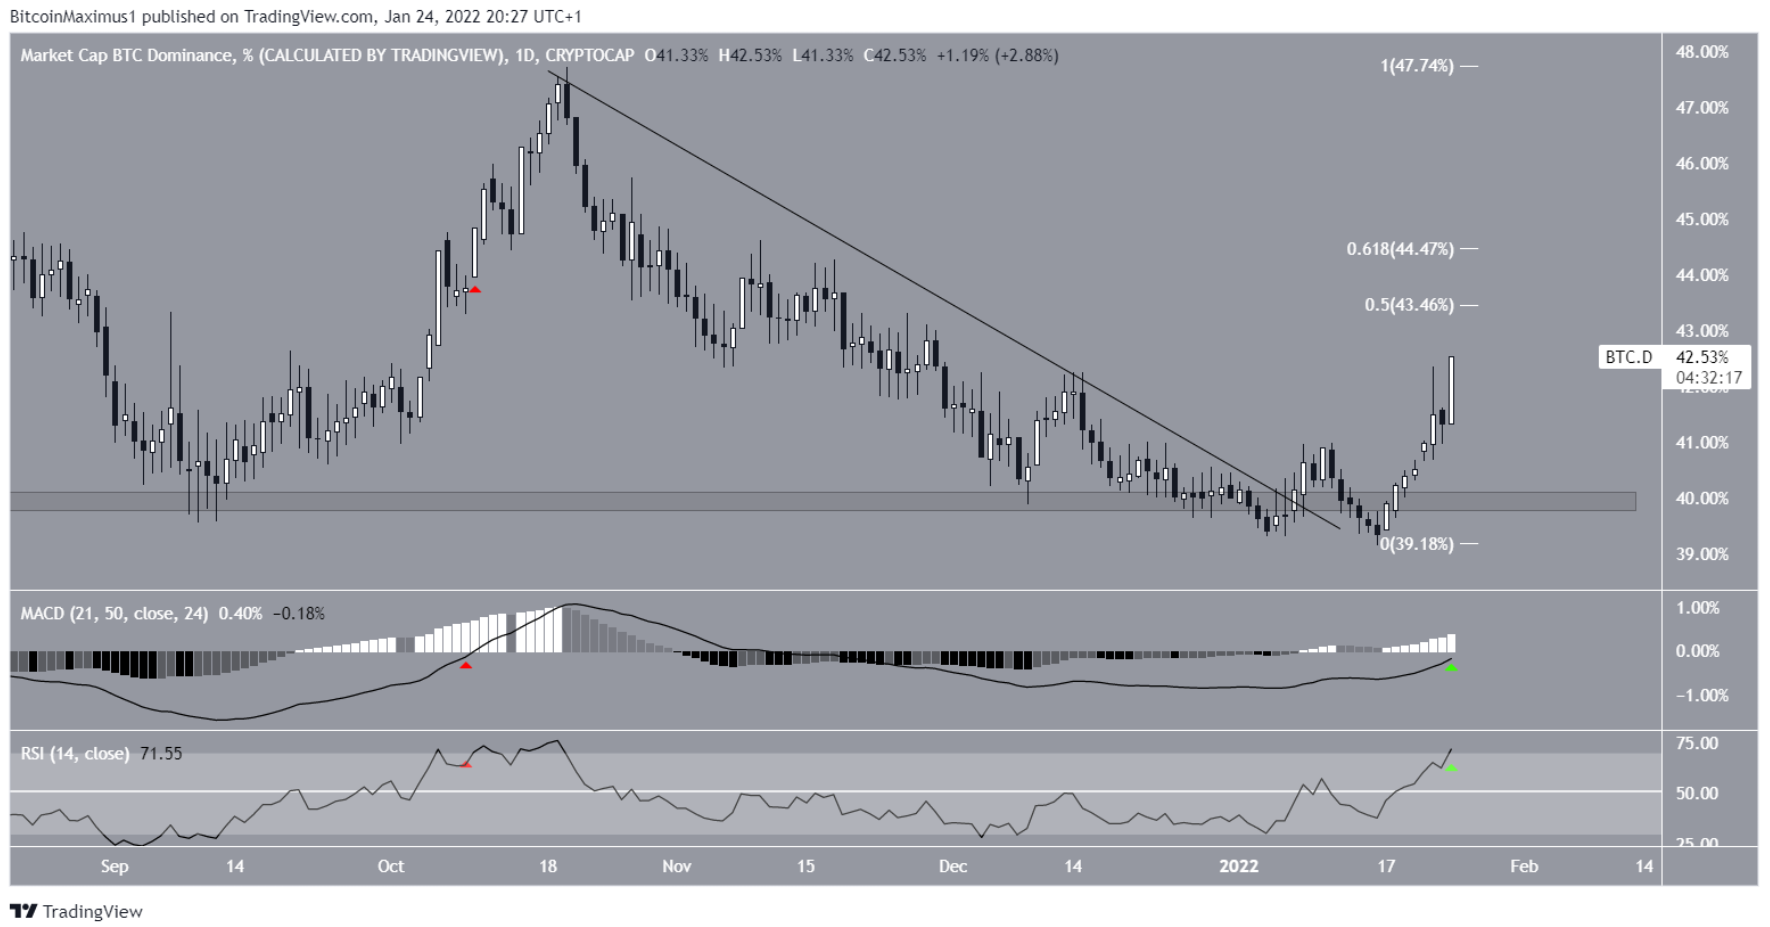
The rally came after BTCD broke above the descending resistance line that had been forming since the aforementioned 47.72% high. On January 24th, it accelerated significantly and created a large bullish candlestick.
BTCD is currently approaching the 0.5-0.618 Fib resistance area, which ranges between 43.45% and 44.45%.
Technical indicators are bullish as both RSI and MACD are rising (green symbol). The RSI is a momentum indicator and values above 50 are considered bullish. It is currently hovering almost above the 70 level. Similarly, the MACD, which is composed of the short-term and long-term moving averages (MAs), is about to break into positive territory.
While both are considered bullish developments, it is worth noting that the last time indicators touched this level (red symbol), BTCD was very close to the 47.72% top, coinciding with the top of the descending resistance line.
Therefore, although BTCD could drop back into the 43.45%-44.45% zone, there is still a chance that it will be rejected if it reaches that zone.
BTCD daily chart | Source: TradingView
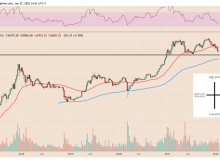
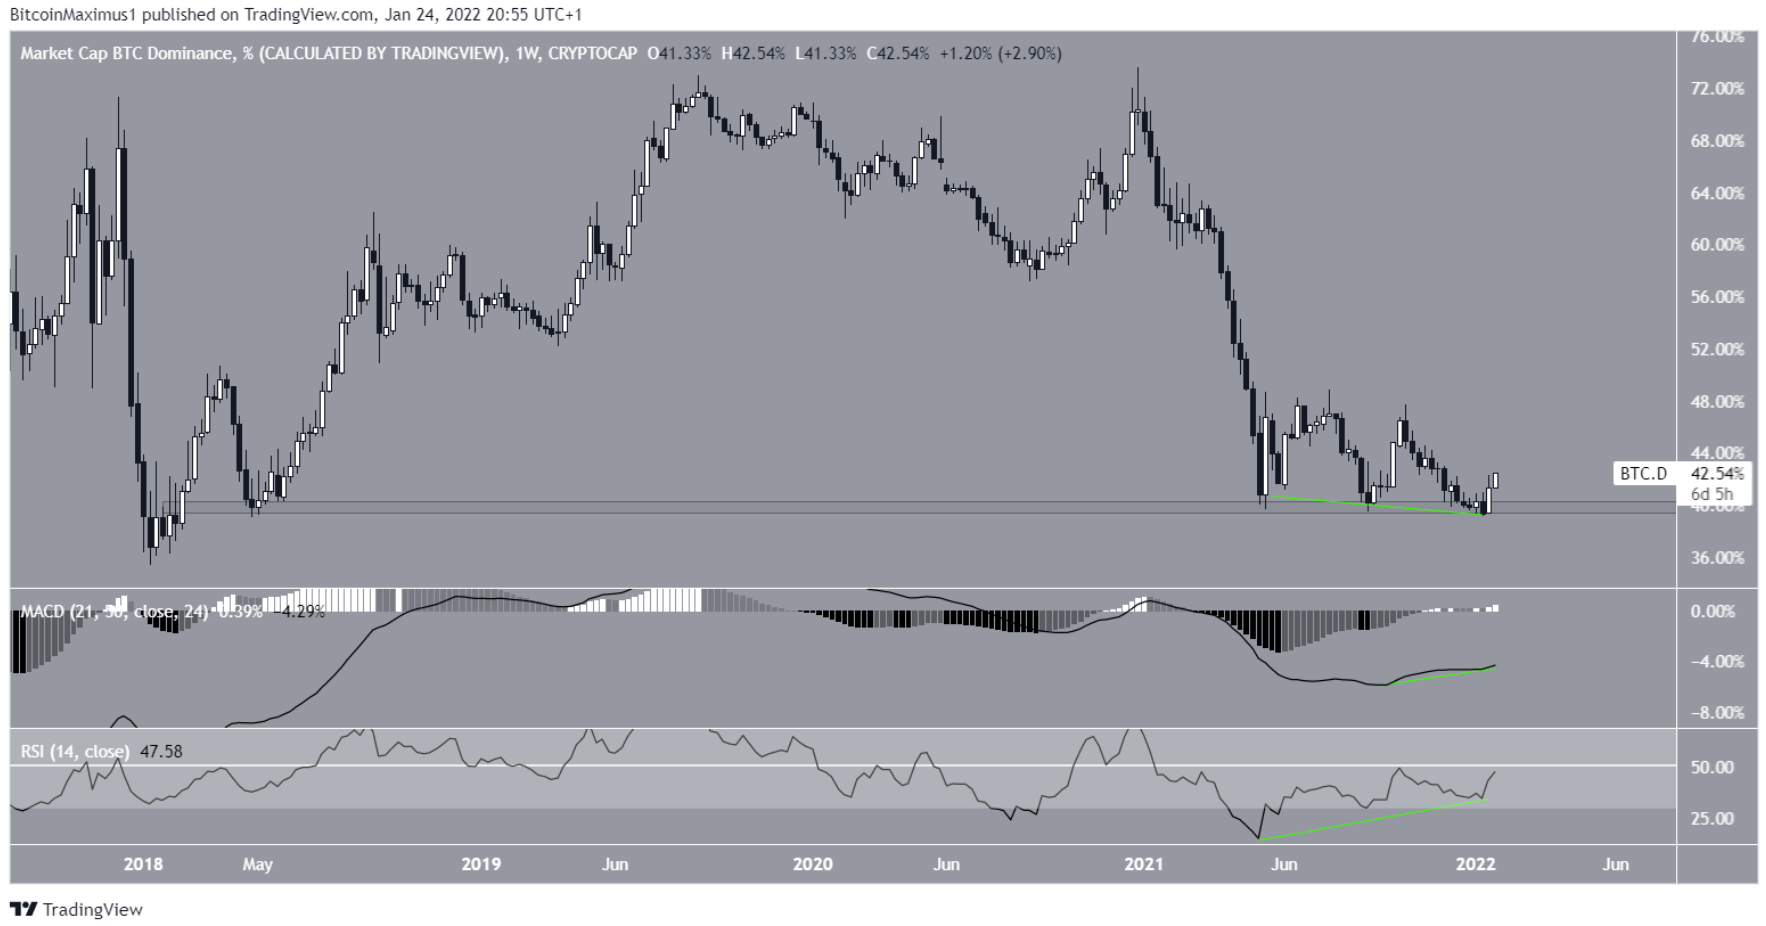
The weekly chart shows the 40% support area as the last line of defense before BTCD hits a potential all-time low. A breakdown below could be the catalyst for a sharp decline.
Both the MACD and the RSI generated significant bullish divergences (green line). This suggests that upward movement is likely thereafter.
BTCD weekly chart | Source: TradingView
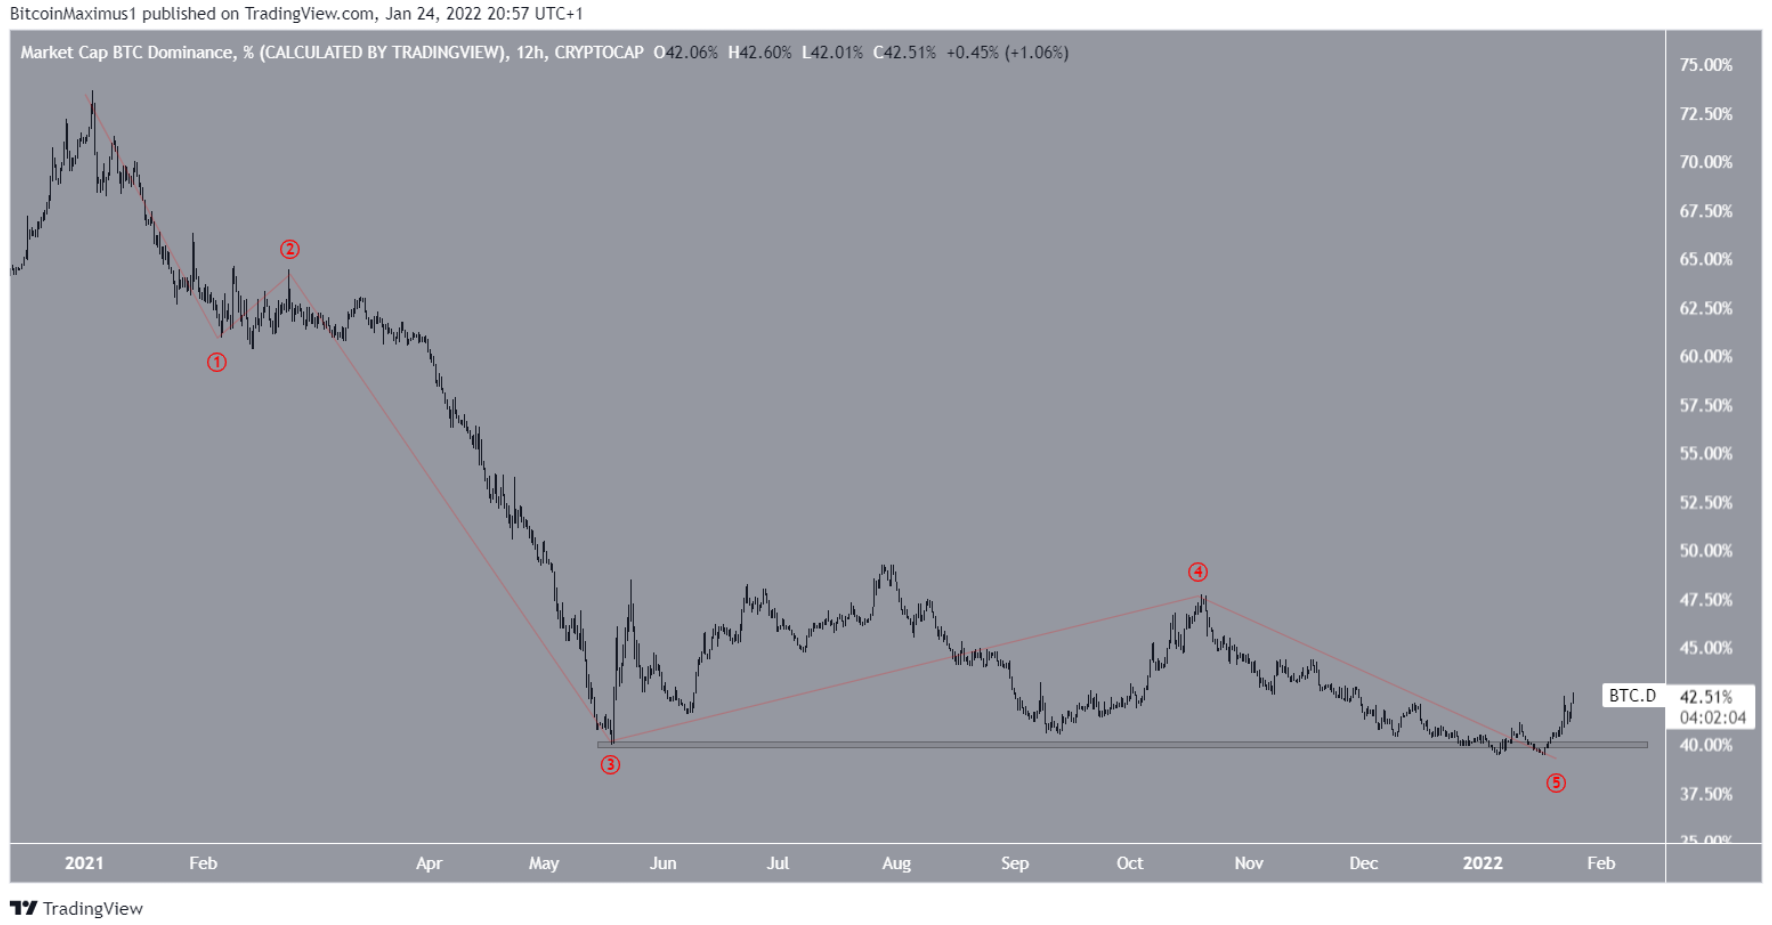
Finally, measuring off the 2021 high, it is clear that BTCD has completed a bearish 5-wave impulse. Although there is a possibility that wave five will expand, the structure still looks complete.
Combining this with figures from the daily timeframe, an eventual breakout above the 43.45%-44.45% zone therefore seems the most plausible scenario.
BTCD 12 hour chart | Source: TradingView
You can see the coin prices here.
Join Bitcoin Magazine Telegram to follow news and comment on this article: https://t.me/coincunews
Disclaimer: This article is for informational purposes only, not investment advice. Investors should research carefully before making a decision. We are not responsible for your investment decisions.
SN_Nour
According to beincrypto