
Has Bitcoin (BTC) Completed the Correction? – Elliott Wave Analysis
BTC has been correcting for almost a year, since the April 14, 2021 high to be precise. It is possible
According to the Elliott Wave theory, Bitcoin (BTC) has reached or is about to end the correction that started in April 2021.
Of the three most likely scenarios for short-term BTC moves, two suggest that the price has bottomed.
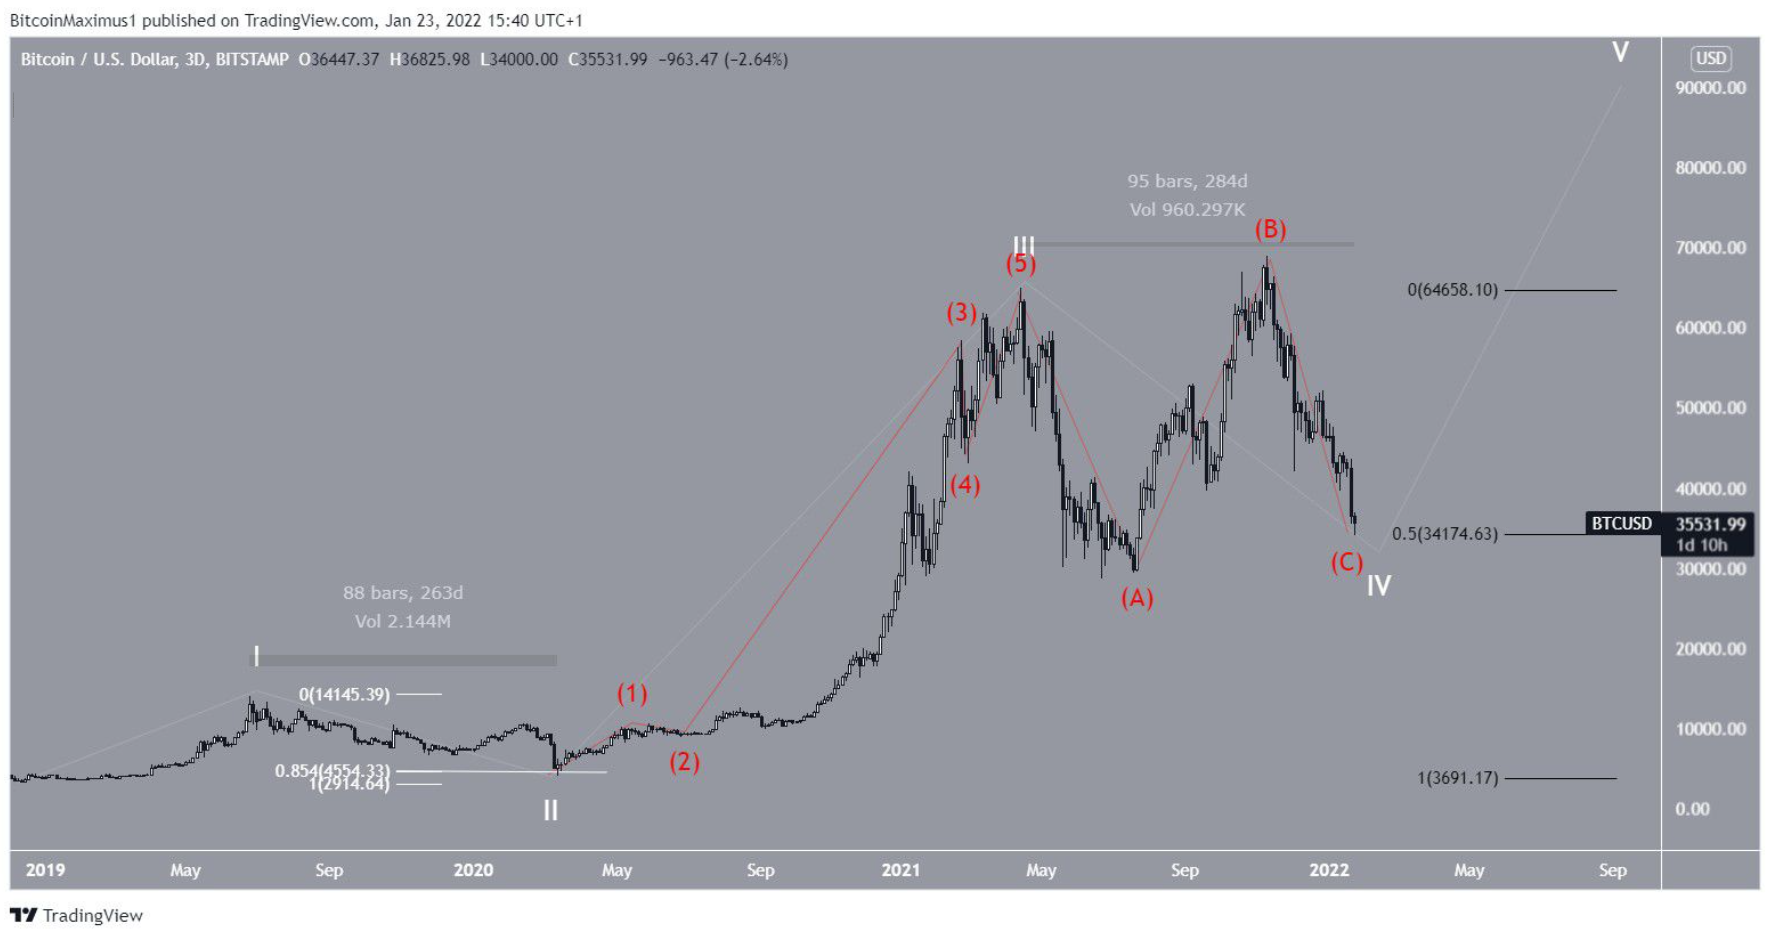
In December 2018, BTC started a five-wave bullish pulse (white) and it is still ongoing. If true, BTC is now nearing the end of wave four and further upward movement to the end of wave 5 will follow. The number of partial waves is shown in red below.
Waves two and four are about the same length, the former lasting 263 days while the latter took 284 days to develop.
Because of the concept of alternation, there is a clear difference between these two waves in terms of time, complexity, or retracement.
Since wave two ends at 0.85 Fib retracement (white), wave four will be shallower, potentially ending at 0.5 Fib retracement (black). This is where BTC is currently trading.
BTC/USDT 3-day chart | Source: TradingView
There are three main possibilities for the short-term move and all point to BTC nearing the end of a correction. Trader @TheTradingHubb tweeted a BTC chart and said the correction will be over soon.
The source: Twitter
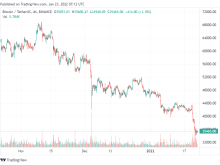
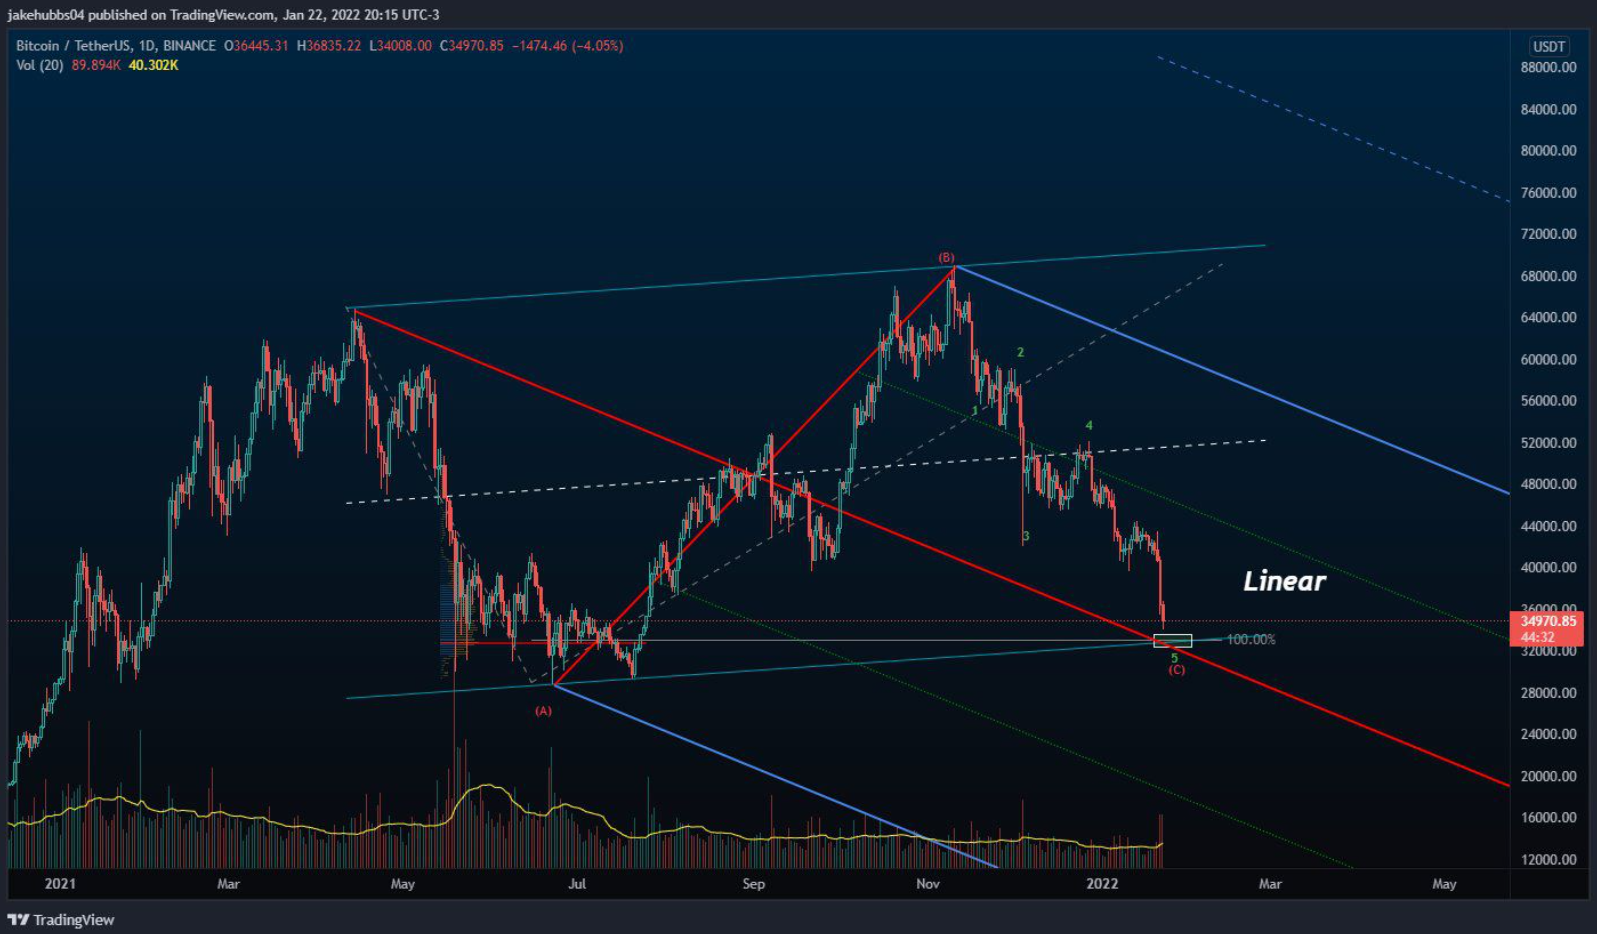
The scenario outlined in the tweet is a regular flat corrective pattern. In this pattern, BTC appears to be in wave C (red), which will complete a correction at the $33,300 support.
A low near $33,300 creates a 1:1 wave A:C (red). Alternatively, it will coincide with the support line of an ascending parallel channel that contains all of the move since April.
BTC/USDT daily chart | Source: TradingView
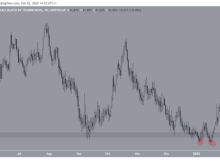
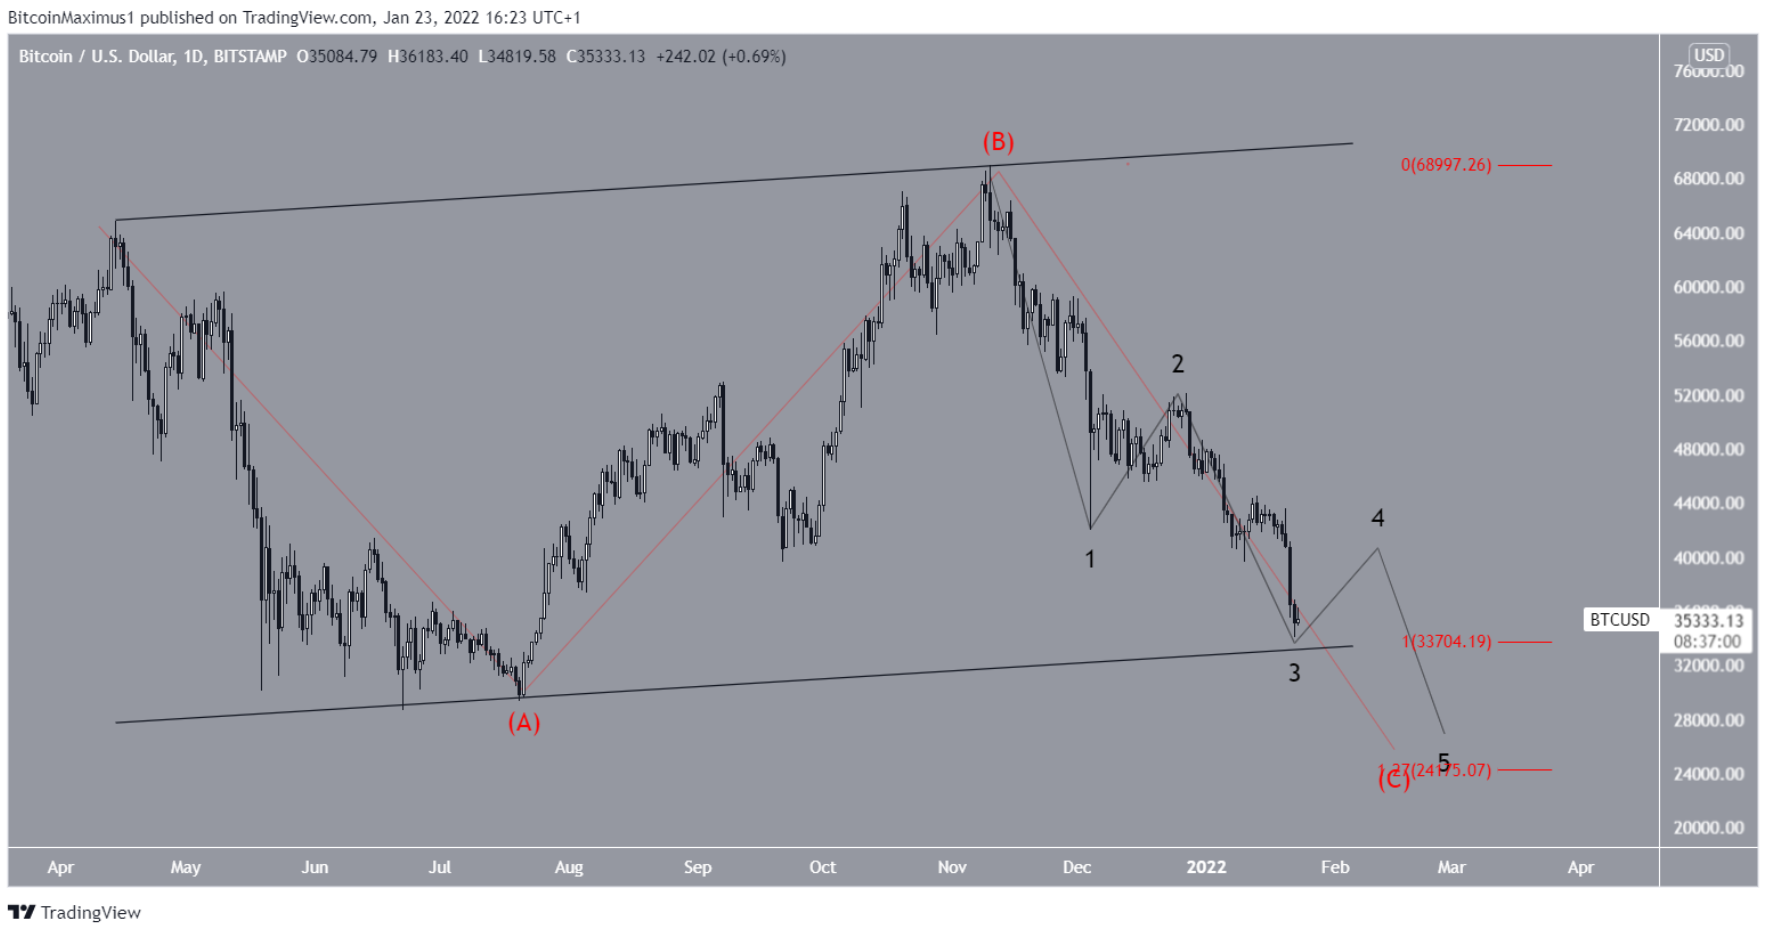
The second possibility is that BTC completes the fourth wave of an extended flat correction. During such corrections, wave C is typically about 1.27 or 1.61 times longer than wave A.
A target of 1.27 will lead to a low of $24.175. If true, BTC could rally to complete the fourth sub-wave (black) and then fall once more to complete the recent decline.
1.61 target is $12,175. A drop to this level will invalidate the entire bullish structure as wave four will fall back into wave one territory. Therefore, it seems unlikely that it would fall that low.
BTC/USDT daily chart | Source: TradingView
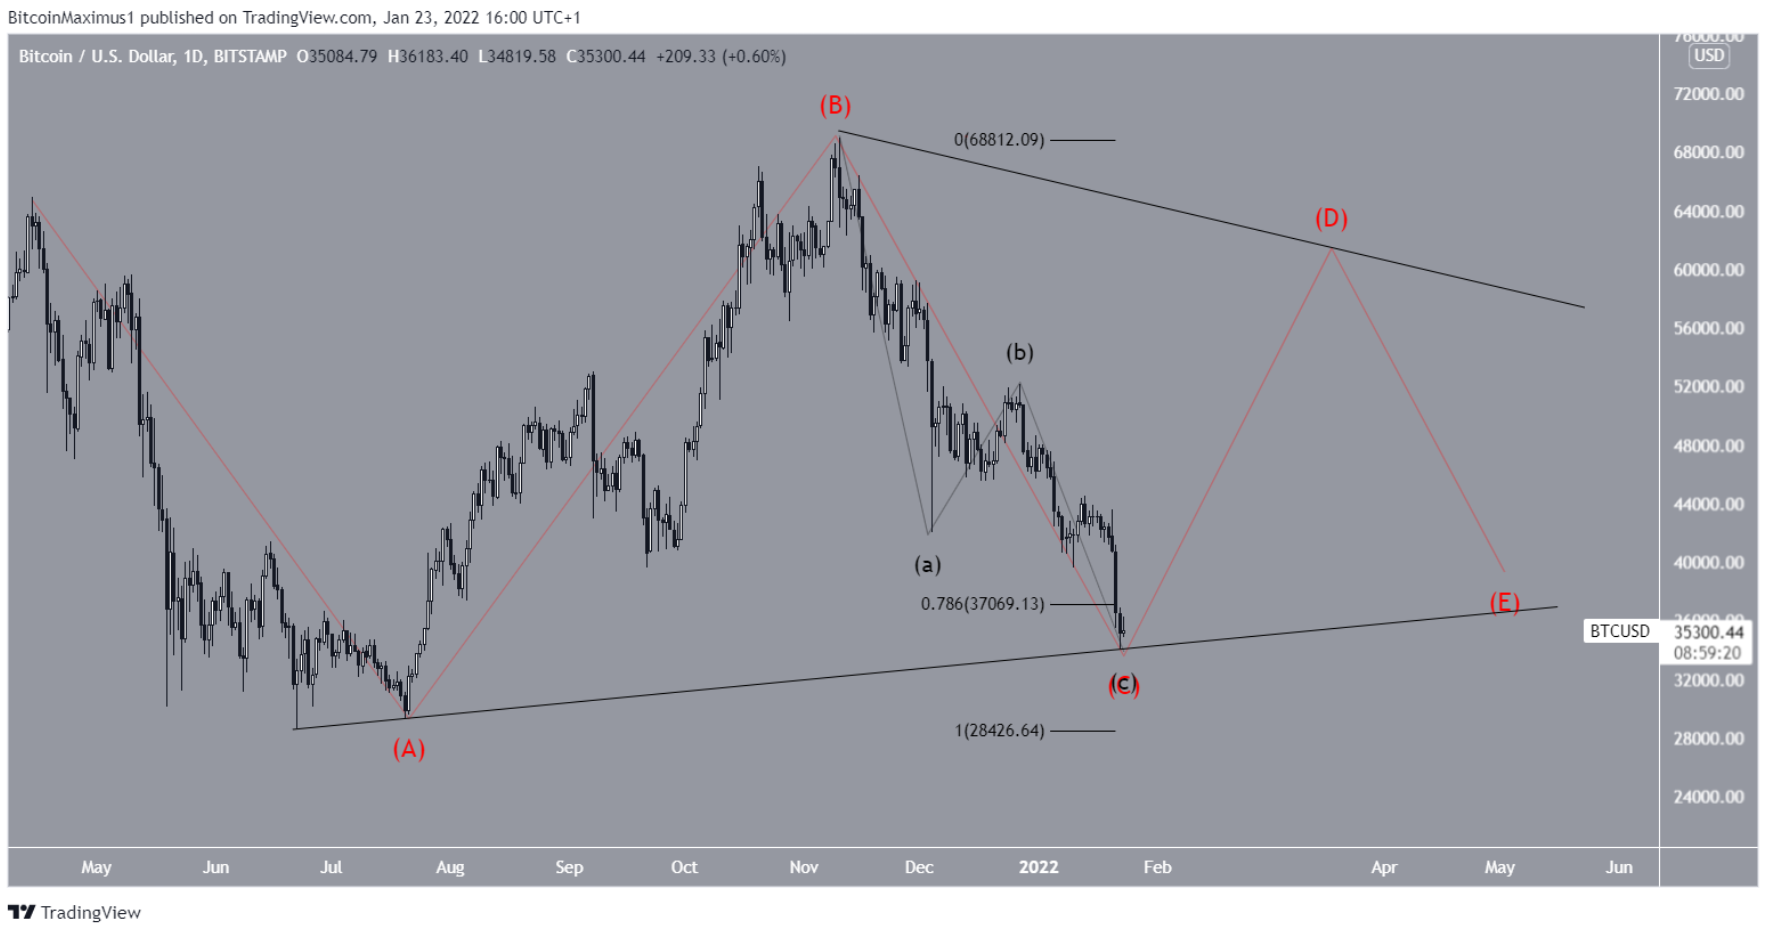
The last possibility is that BTC completes a triangle that contains wave 4.
One of the main rules of the triangle is that each wave must not retrace past the 0.786 Fib retracement level. Wave C is just around the corner. As a result, BTC is forced to bottom at current levels and reverse its trend.
The short-term volatility in this case will be similar to that of the regular flat adjustment model mentioned above.
However, the price may consolidate for a long time before making a final breakout.
BTC/USDT daily chart | Source: TradingView
You can see the BTC price here.
Join Bitcoin Magazine Telegram to follow news and comment on this article: https://t.me/coincunews
Disclaimer: This article is for informational purposes only, not investment advice. Investors should research carefully before making a decision. We are not responsible for your investment decisions.
SN_Nour
According to beincrypto