
26. Technical Analysis: BTC, ETH, XRP, FTT, ATOM, BNB, IOTA
Bitcoin Magazine will look at the price action of seven different cryptocurrencies, including Cosmos (ATOM),
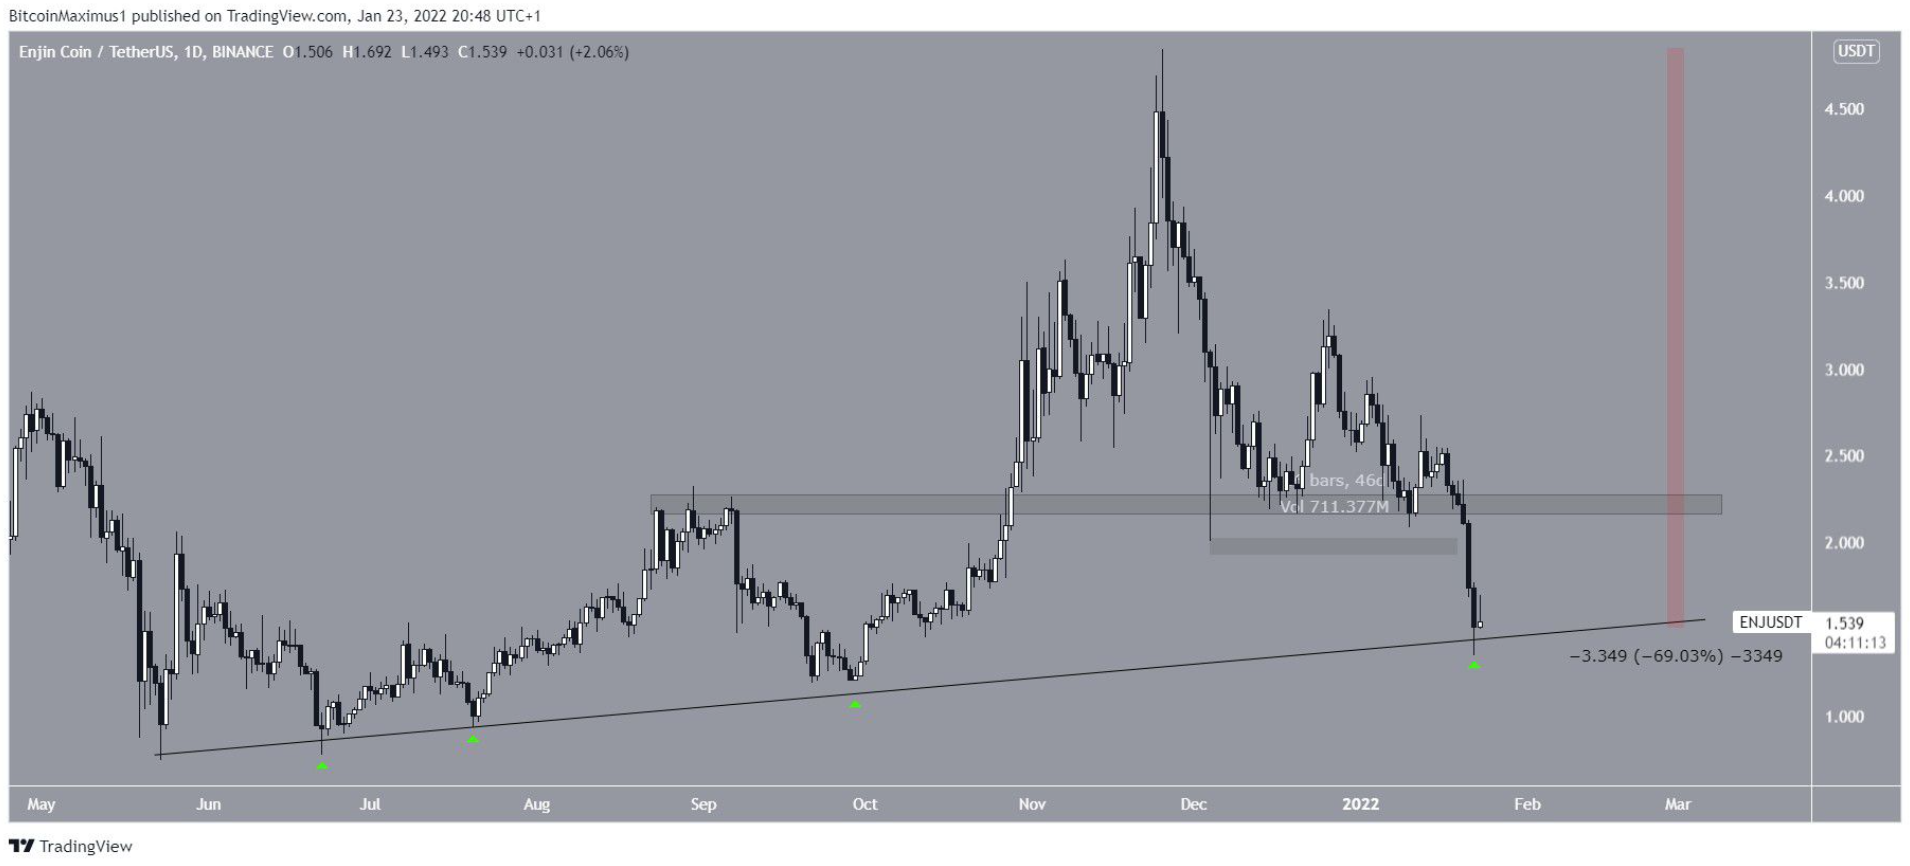
Enjin Coin (ENJ) has fallen below a key horizontal area that is now acting as resistance. Until this zone is restored, the trend cannot be considered bullish.
Enjin Coin has been falling since November 25 after hitting an all-time high of $4.84. The initial downside was halted on Dec 4 when ENJ bounced off the $2.22 horizontal support area, creating a long wick below it.
ENJ managed to stay above this level for 46 days before finally falling below it on January 20th. To this point, ENJ is down 69% from its all-time high.
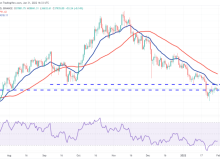
The price bounced off the ascending support line that has been forming since May. This is the fourth time this line has been confirmed as support (green symbols). As this is a long-term structure, ENJ could recover from this line.
In that case, the $2.22 zone is likely to act as resistance.
Daily ENJ/USDT chart | Source: TradingView
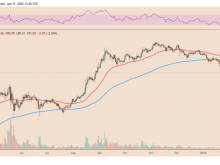
Technical indicators for the daily time frame are showing that the price is oversold. At first glance, this can be seen with the Bollinger Bands indicator, which uses standard deviation to determine when the price deviates above/below its normal range.
Currently, ENJ has fallen below the lower band of the indicator. Each time this has happened in the past, it has been followed by a noticeable jump (green icons).
Furthermore, the RSI is oversold at the 29 level. The RSI is a momentum indicator and levels below 30 are considered oversold. The last time the RSI fell below this level was in May 2021, before the entire rally to all-time highs.
However, both the RSI and MACD are falling, showing that momentum is still fading.
So, while the sharp drop has caused the market to create oversold conditions, there are no signs of a bullish reversal just yet.
Daily ENJ/USDT chart | Source: TradingView
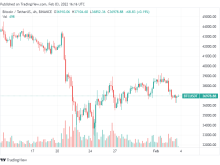
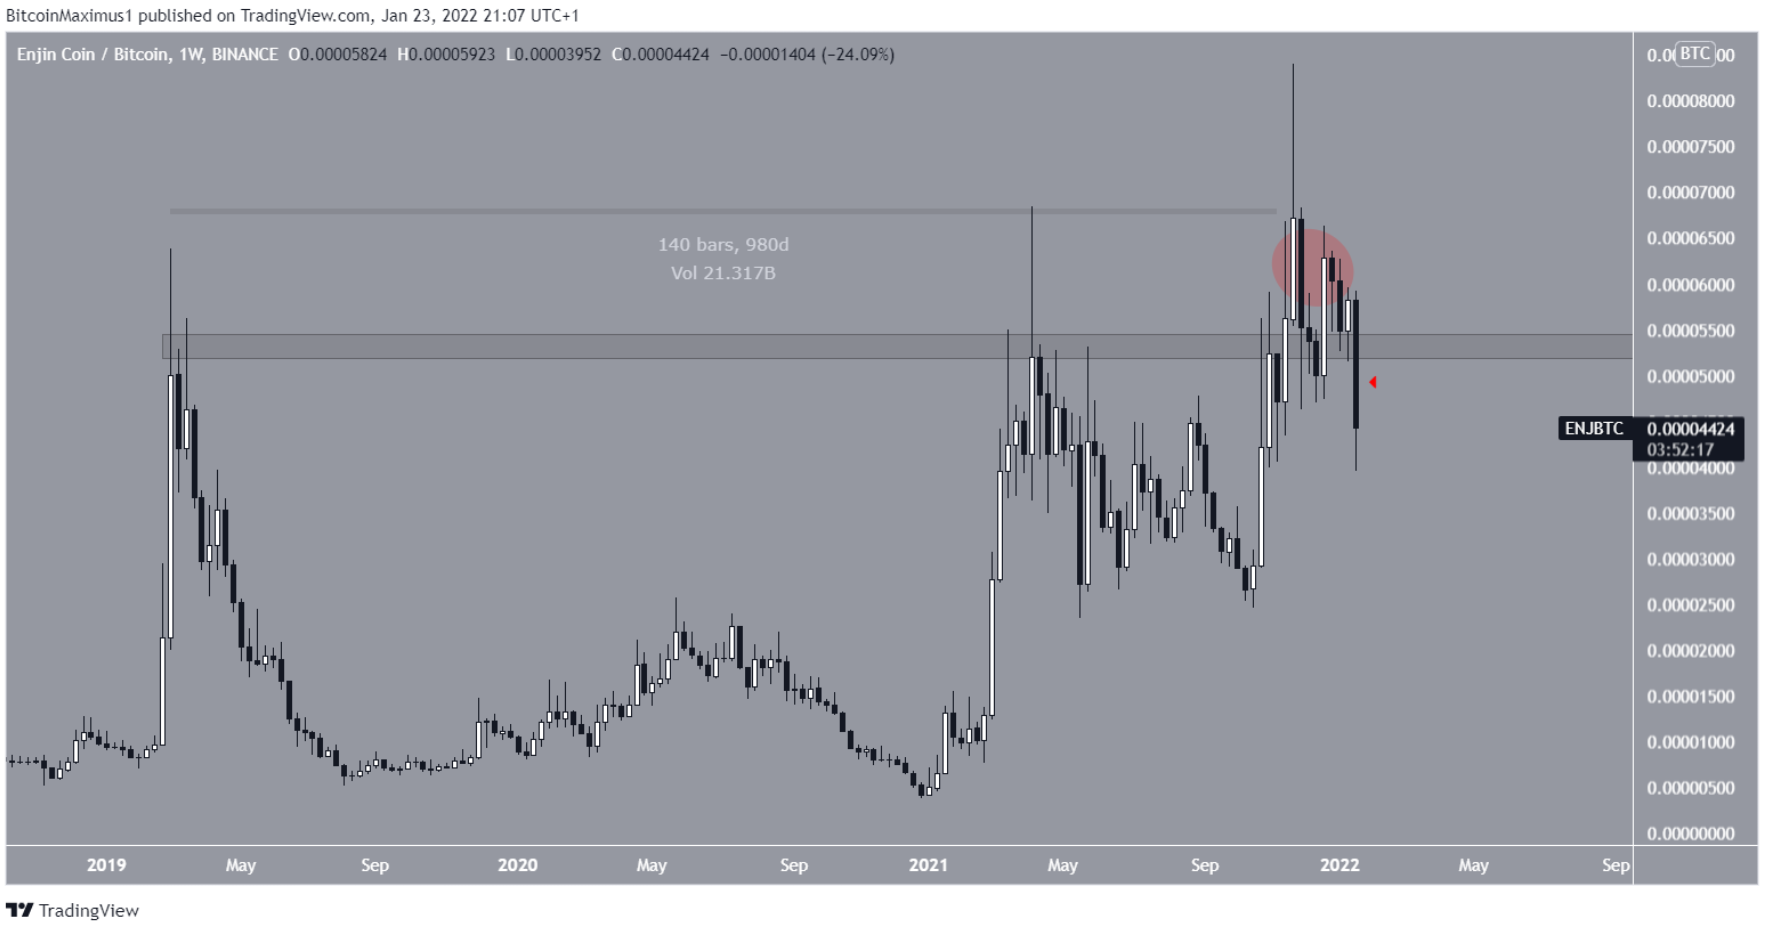
The ENJ/BTC chart also offers a bearish outlook. The pair has faced resistance from the 5,350 satoshi area since January 2019. After 980 days, ENJ finally broke out and hit a high of 8,413 satoshis on November 25th.
At the time, this was looking like a decisive break above the long-term resistance area.
However, the upward movement did not last and ENJ fell back below this resistance on Jan. 19th.
Therefore, the previous breakout is now considered a deviation (red circle). Until ENJ manages to reclaim the 5,350 satoshi zone, this trend cannot be considered bullish.
Weekly ENJ/BTC chart | Source: TradingView
You can see the ENJ prices here.
Join Bitcoin Magazine Telegram to follow news and comment on this article: https://t.me/coincunews
Disclaimer: This article is for informational purposes only, not investment advice. Investors should research carefully before exiting
SN_Nour
According to beincrypto