Virtual currency market fell again, Bitcoin fell to $35,000, Solana fell another 17%
Virtual currency market fell again, Bitcoin fell to $35,000, Solana fell another 17% Bitcoin fell to $35,000
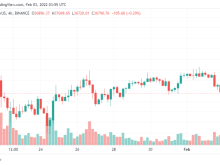
Bidding farewell to three unforgettable days, Bitcoin fell below $34,400 late last week before bouncing back yesterday.
At press time, the world’s largest cryptocurrency by market cap is trading near $36,000, up more than 1% in 24 hours. Trading volume fell more than 33% as many investors continue to assess the difficult economic conditions and sharp decline in stock markets.
The tech-heavy Nasdaq index fell 2.7% on Friday as investors continued to flee the leading stocks in recent years. The other two major indices, the Dow Jones Industrial Average and the S&P 500, fell 1.3% and 1.8%, respectively. The market decline was due to widespread concerns about interest rates, supply chain inefficiencies and the ongoing coronavirus.
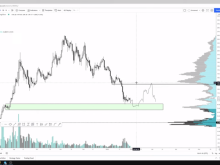
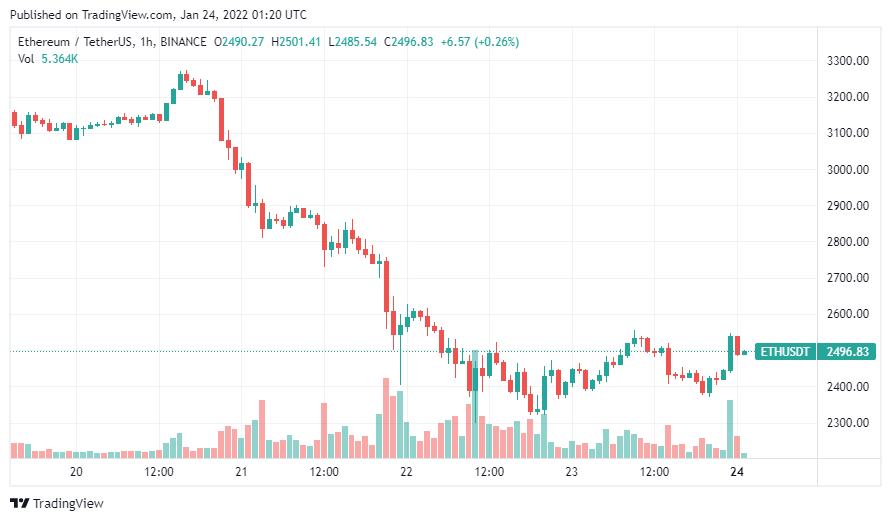
Ether fell below $2,400 on Saturday before reviving closer to $2,500. The second largest cryptocurrency by market cap is up more than 2% in the last 24 hours. Most major altcoins spent Sunday in the red.
ETH/USDT. Source: TradingView
Joe DiPasquale, CEO of crypto fund BitBull Capital said:
“Markets hold their breath as investors watch as Asia opens up for signs of what’s next. If Asian markets open strongly, we can expect a pick-up in demand for cryptocurrencies, and even more so if US markets have a strong Monday.”
“Cryptocurrency is still trying to prove whether it is a digital hedge like gold moving against stocks, or a risky asset that will fail if stocks continue to tumble Monday as many have Stock indexes did on Friday. Although the most optimistic arguments for crypto investing cite long-term data showing that bitcoin is uncorrelated with other asset classes, data over the past two years has shown a correlation between bitcoin and another asset class: bitcoin and stock prices.”
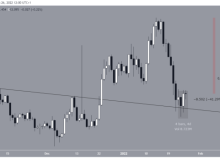
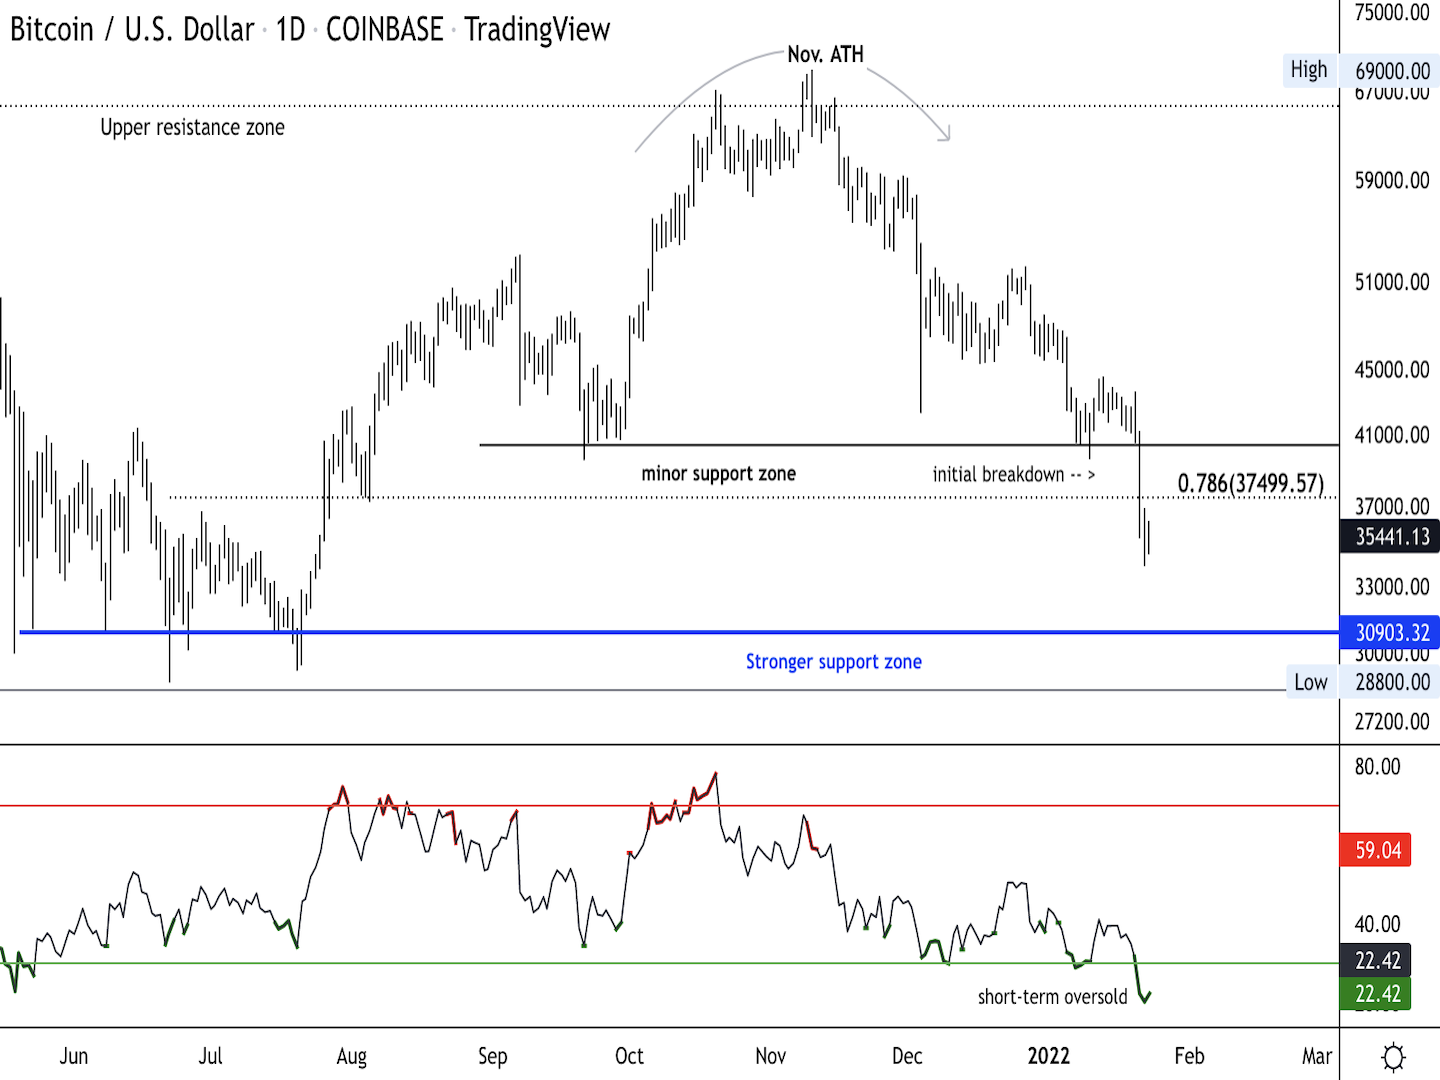
BTC/USD. Source: TradingView
Bitcoin has rallied to nearly $36,000 but is still down 16.3% over the past week. Slowing momentum on the monthly and weekly charts has been a constant theme since December. When the long-term uptrend wanes, sellers often outperform buyers, although there is sometimes a signal.
Additionally, when the pullback (percentage of drop from high to low) becomes severe, short-term traders tend to reduce the size of their positions and oscillate around the intraday support and resistance zones.
Bitcoin is down about 48% from its all-time high of $69,000, marking a significant drop. The previous extreme drop was in July, when BTC slipped to nearly $28,000 with a 50% loss from its peak.
For now, initial support stands around $35,000-$37,000, which could stabilize the current sell-off. The Relative Strength Index (RSI) on the daily chart has been extremely oversold since May 19th.
If selling pressures accelerate this week, BTC could find stronger support around $30,000.
You can see the bitcoin price here.
Join Bitcoin Magazine Telegram to follow news and comment on this article: https://t.me/coincunews
Disclaimer: This article is for informational purposes only, not investment advice. Investors should research carefully before making a decision. We are not responsible for your investment decisions.
annie
According to Fxstreet